


How To Use A Scatter Plot Diagram To Measure Behavior Change
An old school method that works

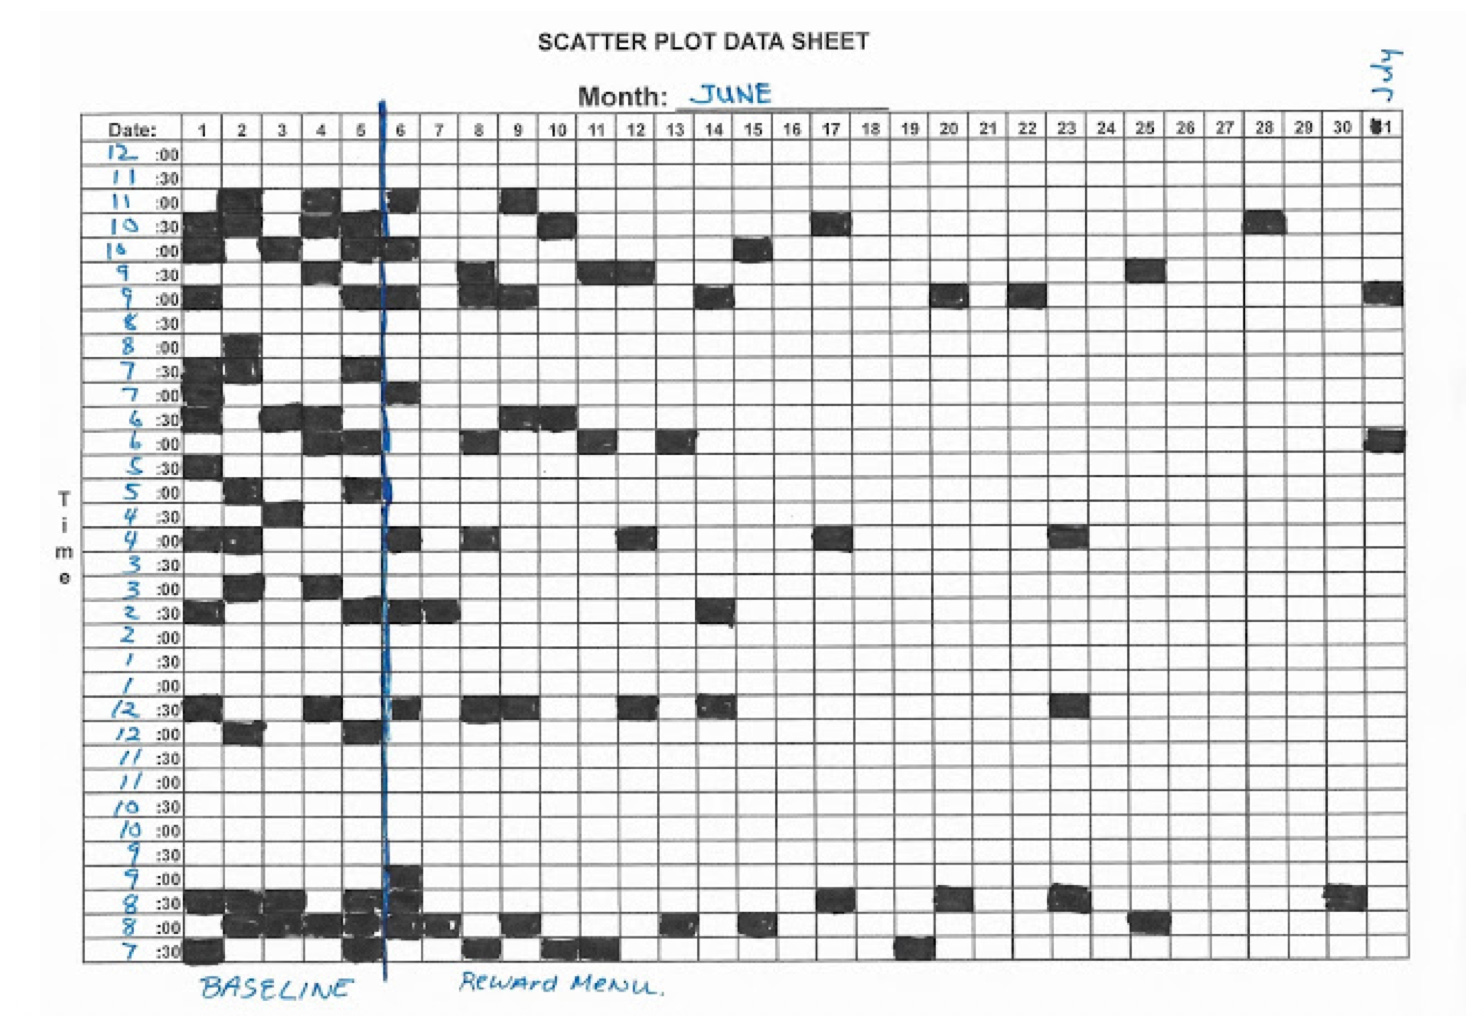
I promised to discuss easy ways for parents and teachers to collect data on themselves, their children or their students. The scatter plot diagram as displayed above is an old school easy way to display behavioral data to see if it is occurring more or less often.
Each box is an interval of time (e.g., 15 minutes). If the behavior occurs during the interval, notice what day it is and what time it is and mark the corresponding box. The idea is to take baseline data for 3-5 days or so until the trend appears stable either up, down, or sideways. Once stable draw a vertical line on the graph on the day you begin your intervention. Then continue to collect data. Compare the new trend with baseline to see if your intervention is working or not. Afterward, if you decide to change the intervention draw another vertical line on the graph and continue to collect data. Compare the trends.
The figure above is an example of a scatter plot diagram used to measure the frequency of tantrums using interval recording. If you are measuring misbehavior (tantrums) improvement is seen when fewer boxes are marked over time. If you are measuring appropriate behavior (homework, piano practice) improvement is seen when more boxes are marked over time.
In the above example, sample data is recorded on tantrums. During baseline (boxes left of the blue line) tantrums ranged from 5 intervals checked per day to 12 intervals checked per day. A reward program began on day 6. By the end of the month tantrums only occured during 1 or 2 intervals per day. You can see the improvement displayed on the graph: many boxes check during baseline, fewer boxes checked each day as the reward system takes effect.
The month is listed on the top of the form. The days of the month are listed across the top of the form from 1-31. Since June has 30 days the last column of boxes represent July 1. However, I recommend you use a new form for each month. The time of day is listed on the left side of the form. Times begin here at 7:30 am, but you can start the time intervals at any time, depending upon when your child awakens each morning or if you are only taking data for limited periods, such as the morning, after school or after dinner, e.g., from 6pm to 11pm. Notice this diagram has 30 minute intervals. You can decide to have 15 minute intervals or any interval you choose. If the behavior occurs frequently, have smaller intervals, if the behavior is infrequent pick a larger interval. In this example I picked 30 minute intervals because we can track a whole day on one sheet. But overall I found 15 minute intervals to be more sensitive to behavior change. I recommend using 15 or 10 minute intervals.
Why collect data on behavior?
If your child is having behavior problems it is helpful to take baseline data to see how often and at what times your child misbehaves. Is the problem in the morning getting off to school, or is the problem after school, or during mealtimes? After taking baseline data, you may decide to start a reward program for compliance and see if that program is effective in improving compliance and reducing tantrums. Compare the child’s progress with the baseline levels. Each week review the data and see whether your program is working.
You may decide to change your program (or not) depending upon the data obtained. Do you see improvement? If you don't take data, your gut feeling about improvement most likely will be wrong. People tend to focus on the last instance of the behavior, not the trend of the data. Over the past week your child may have improved, but you may discount the improvement because you just experienced a tantrum a few moments ago. That may lead you to abandon an effective program. Viewing documented improvement will give you more confidence and reduce your anxiety about your child's behavior. It will help you maintain the effort required to run the reward program.
To use a scatter plot diagram do the following:
1) Decide what behavior (s) you wish to track.
2) Define the behavior, e.g., hitting is defined as striking another person with their hand, arm, fist, or kicking another person with their foot. If you have a spouse or partner to help you, make sure you both agree on the definition of the behavior.
3) If you observe the behavior remember the date, look at a clock to obtain the time of day and make a mark for that day and time in the corresponding box. If the behavior occurs more than once in an interval, just make one mark in the corresponding box, not 2 or 3 marks. If the tantrum extends to the next interval, mark that interval too. Then you will be able to measure improvements in duration. The diagram is designed to accurately reflect improvement over time. The diagram also provides information about what time the behavior occurs each day. In this example the child has more behavior problems during the morning and evening routines.
4) If you want to track more than one behavior (hitting and screaming) put a H in the box when s/he hits and an S in the box when s/he screams, or an HS if s/he does both behaviors at the same time. Some people use different colored markers for each behavior.
Tracking 1 or 2 behaviors is easy. Tracking 3 or more behaviors on the same graph is more difficult. I don’t recommend tracking more than two behaviors on one graph.
5) Collect data every day. If you stop recording the behavior on the scatter plot, the diagram will appear to show improvement when in fact there was no improvement. You simply did not record the instances of behavior.
Free Scatter Plot Diagram
Below is a blank scatter plot data sheet. I've used this form hundreds of times with many parents. It is very easy to use. Most parents like using the form. Feel free to copy and enlarge it or recreate it using graph paper.
I believe the scatterplot diagram was developed by Paul Touchette and popularized by Brian Iwata.
Touchette, P. E., MacDonald, R. F., & Langer, S. N. (1985). A scatter plot for identifying stimulus control of problem behavior. Journal of Applied Behavior Analysis, 18(4), 343–351. https://doi.org/10.1901/jaba.1985.18-343
